

This article is about Scalable Vector Graphics (SVG) on your web pages. I would have classed it as a HTML 5 tutorial but it is not strictly speaking to do with HTML 5 although it does use HTML to display the images.
An SVG is a file that has been written in XML and contains all of the information needed to draw the image on the screen in text. This way the browser knows exactly how to re-scale it depending on the viewing area so there is no loss of quality when viewing on a small or large screen.
You can of course create graphics using the HTML 5 Canvas and your browser will do a fair job in resizing it to match the screen or area you are using. The problem with the browser re-scaling the Canvas image is that the Canvas is made up of tiny coloured dots. Reducing the size means less dots and increasing the size means more dots than originally intended so the browser has to guess what to do with the shortfall or excess.
SVG Example Shapes
In this example, we will draw a circle, square, triangle and a line drawing as a Scalable Vector Graphic and include that in a HTML document. There are two text based files to create, svg1.svg and svg1.html.
The code within the HTML 5 file (svg1.html) is as follows:
<!DOCTYPE HTML>
<html>
<head>
<meta charset=”utf-8″>
<title>Scalable Vector Graphics</title>
</head>
<body>
<h1>Scalable Vector Graphics</h1>
<img src=”svg1.svg” width=”100%” height=”100%” />
</body>
</html>
The code within the XML file (svg1.svg) is as follows:
<?xml version=”1.0″ encoding=”utf-8″?>
<svg version=”1.1″ xmlns=”http://www.w3.org/2000/svg” height=”100%” width=”100%” viewBox=”0 0 600 150″ preserveAspectRatio=”none”>
<circle cx=”90″ cy=”70″ r=”50″ fill=”#ff0000″ stroke=”#800080″ stroke-width=”4″ />
<rect x=”180″ y=”20″ width=”100″ height=”100″ fill=”#00ff00″ stroke=”#008080″ stroke-width=”4″ />
<polygon points=”320,120 370,20 420,120″ fill=”#00ffff” stroke=”#0000ff” stroke-width=”4″ />
<polyline fill=”none” points=”460,20 560,20 460,120 560,120 510 70″ stroke=”#008080″ stroke-width=”4″ />
</svg>
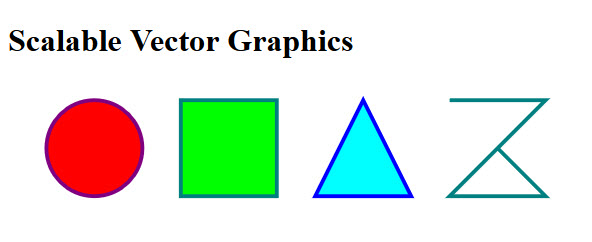
Basically, the svg1.svg XML file is used as the source (src) of the image (img) tag in HTML. You can also use the embed tag rather than the image tag but embed is not part of the HTML 5 specification so future browser support cannot be guaranteed. The real size of the image is 600 points wide by 150 points high but by setting the image to 100% in the HTML5 file it will fill the page and resize accordingly.
The XML file uses the svg tag to contain all of the elements of the image. In this example we have three shapes; a circle, a rectangle and a triangle. Circles and rectangles are easy; a rectangle has an x and y position left top starting point and a width and height, a circle has an x and y central starting position and a radius (cx, cy and r). If you specify a colour to fill it will create a solid coloured object. If you specify a stroke and stroke width it will draw an outline on the shape (a border).
Triangles and other shapes that do not have four sides and are closed are called polygons. In these you set points which are co-ordinates on the page. There must be an even number of numbers because each coordinate is made up of two numbers. Each point (coordinate) is made up of an x and y point so in this example the first 320,120 tells the polygon to start drawing at 320 from the left and 120 from the top, then to draw to 370 from the left and 20 from the top (the top most point of the triangle) and lastly to draw to 420 from the left and 120 from the top. The polygon knows automatically to fill in the remaining line back to the starting position to complete the triangle.
The final shape is drawn as lines using the polyline shape. This shape does not automatically join up to its starting position like a polygon. A fill can be used or specified as “none”. If a fill is used the browser will attempt to fill in anything that it can whether it joins or not.
More Polygon Examples
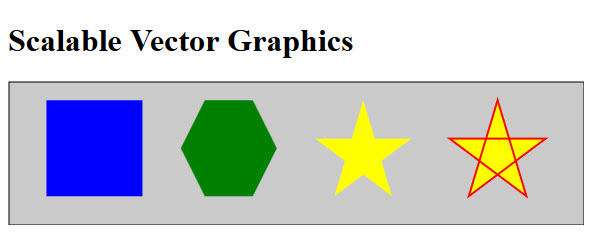
You can of course draw any shape with the polygon, even a rectangle. In this next example we will do just that as well as draw a line around the SVG shape, a square with the polygon shape as well as a hexagon and a star.
You will note from these examples that the colours are named rather than using full hexadecimal as in the previous example. You can also use short hex values such as #00F for blue or use RGB as in rgb(255,255,255) for white.
It’s all the same code as before except the shapes between the svg tags are different. Here’s the XML code in full.
<?xml version=”1.0″ encoding=”utf-8″?>
<svg version=”1.1″ xmlns=”http://www.w3.org/2000/svg” height=”100%” width=”100%” viewBox=”0 0 600 150″ preserveAspectRatio=”none”>
<rect x=”1″ y=”1″ width=”599″ height=”149″ fill=”#cacaca” stroke=”black” stroke-width=”1″ />
<polygon points=”40,120 40,20 140,20 140,120″ fill=”blue” />
<polygon points=”180,70 205,20 255,20 280,70 255,120 205,120″ fill=”green” />
<polygon points=”320,60 420,60 340,120 370,20 400,120″ fill=”yellow” />
<polygon points=”460,60 560,60 480,120 510,20 540,120″ fill=”yellow” stroke=”red” stroke-width=”2″ />
</svg>
SVG Special Effects
The next examples show a square with rounded corners, rotation, transparency and gradients.
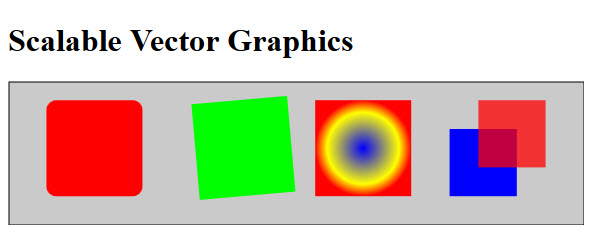
To create rounded corners you use rx for the radius. To move a shape from its original position you wrap the shape in a g tag and use the transform attribute. In this example I have moved the shape ten points down and 20 across and rotated 5 degrees anti-clockwise.
To use a gradient rather than a solid colour you have to create either a linear or radial gradient and then apply it to the fill. Gradients go through stop points from 0 to 1. A linear gradient goes from one side to another and a radial from the centre outwards. In this example I have started with blue and three quarters of the way through specified the colour should be yellow and finish up as red. A straight forward gradient from one colour to another would only have 0 and 1 stop points (start and finish). The gradient needs to have an ID and it is that ID that you call in the fill attribute of the shape i.e. url(#BlueToYellowToRed).
Finally, I have drawn two squares that overlap but have made the second one a quarter transparent so that you can see the square beneath it. This is done by setting the fill-opacity between 0 and 1 with 1 being solid and not at all transparent so in this case for 25% transparency I have set it to 0.75. You could also set the transparency of the stroke using the stroke-opacity attribute in the same way.
Here’s the XML code:
<?xml version=”1.0″ encoding=”utf-8″?>
<svg version=”1.1″ xmlns=”http://www.w3.org/2000/svg” height=”100%” width=”100%” viewBox=”0 0 600 150″ preserveAspectRatio=”none”>
<rect x=”1″ y=”1″ width=”599″ height=”149″ fill=”#cacaca” stroke=”black” stroke-width=”1″ />
<rect x=”40″ y=”20″ rx=”10″ width=”100″ height=”100″ fill=”rgb(255,0,0)” />
<g transform=”translate(10,20) rotate(-5)”>
<rect x=”180″ y=”20″ width=”100″ height=”100″ fill=”rgb(0,255,0)” />
</g>
<radialGradient id=”BlueToYellowToRed”>
<stop offset=”0″ stop-color=”blue” />
<stop offset=”0.75″ stop-color=”yellow” />
<stop offset=”1″ stop-color=”red” />
</radialGradient>
<rect x=”320″ y=”20″ width=”100″ height=”100″ fill=”url(#BlueToYellowToRed)” />
<rect x=”460″ y=”50″ width=”70″ height=”70″ fill=”rgb(0,0,255)” />
<rect x=”490″ y=”20″ fill-opacity=”0.75″ width=”70″ height=”70″ fill=”rgb(255,0,0)” />
</svg>
There are other ways to draw and more options when using SVG and I might cover those in a future article. For now have fun drawing shapes using Scalable Vector Graphics.
If you wish, you can download the example SVG code.
Related articles
Whilst this article is not strictly to do with the new features of HTML 5, I have included it in the same category as my HTML5 articles. You can find an up-to-date list of those in the Development – HTML5 section.