

A while back I gave an HTML5 overview with the intention of writing more about each of those areas. So this is one of those and is dedicated to the HTML5 canvas. It is quite long as I wanted to cover as many features as I could in the one article. As the canvas relies on JavaScript, I’ll also cover that as well as the basics you need for the HTML5 page structure.
The HTML5 canvas allows you to specify a portion of a web page that you can draw directly on using JavaScript. You can still use your server side code to populate the values of the canvas so the page can be drawn dynamically using say values from a database but those values will remain static without a call back to the server. As the HTML5 canvas uses JavaScript, which is a browser side scripting language rather than a server side one, the actions of the user can be dynamically reflected on the page they are viewing.
There have been many attempts to have drawing tools in the browser and to provide something consistent across browsers and now we have that with HTML5 canvas. This article is made up of examples in a tutorial fashion. The code is shown for each example as well as a screen shot of the resulting page. If you are familiar with HTML5 and JavaScript you might want to skip to example 3.
1. A basic HTML5 template
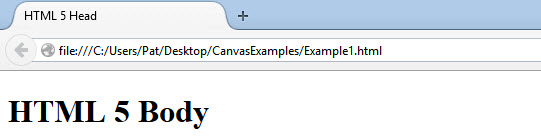
This first example shows the minimum structure for a HTML5 page with a title shown as page content. This code behind a web page is made up of a HTML tags and most of these are in pairs such that can contain other tags. The main thing to know is that the “head” section contains important information that the browser needs to know and the “body” section contains the content to be displayed on the page.
<!doctype html>
<html lang=”en”>
<head>
<meta charset=”utf-8″ />
<title>HTML 5 Head</title>
</head>
<body>
<h1>HTML 5 Body</h1>
</body>
</html>
The above code will show a title in the browser itself and also on the page.
2. A basic JavaScript example
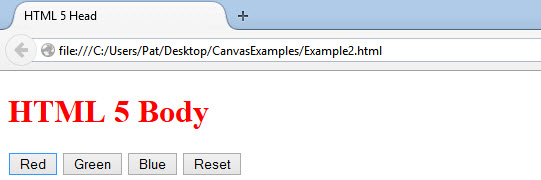
This example shows how you can change an element on a page without sending a request back to the server. If you didn’t use JavaScript then clicking on these buttons would have to send the request back to the server and the server would have to send back the whole page with any changes. Using JavaScript we can make changes on the fly without having to redraw the whole page.
In this example, I’ve included 4 buttons each with a different way to perform the same action in JavaScript. There are other ways to do the same thing that I’ve excluded such as using the JQuery library. In the head section I’ve included some JavaScript functions that I will use on the blue and reset buttons.
<!doctype html>
<html lang=”en”>
<head>
<meta charset=”utf-8″ />
<title>HTML 5 Head</title>
<script>
function O(obj)
{
if (typeof obj == ‘object’)
return obj;
else
return document.getElementById(obj);
}
function S(obj)
{
return O(obj).style;
}
</script>
</head>
<body>
<h1 id=”title”>HTML 5 Body</h1>
<input type=”button” value=”Red” onClick=”var x = document.getElementById(‘title’); x.style.color = ‘red’;” />
<input type=”button” value=”Green” onClick=”document.getElementById(‘title’).style.color = ‘green’;” />
<input type=”button” value=”Blue” onClick=”var x = O(‘title’); S(x).color = ‘blue’;” />
<input type=”button” value=”Reset” onClick=”S(‘title’).color = ‘black’;” />
</body>
</html>
The “h1” tag has been given an identity “title” that we call using JavaScript. Each of the buttons from left to right has progressively less JavaScript code in the OnClick event of the button to do the same thing. The “red” button assigns variable “x” the identity of the object and then instructs it to apply a style. The “green” button does the same thing but calls the object directly and applies the style in one step. The “blue” button takes advantage of the JavaScript functions that I added in the head section. Lastly the “reset” button uses just the styling function as that in turn calls the object function and creates a reference to the object if it is needed.
3. A basic HTML5 canvas
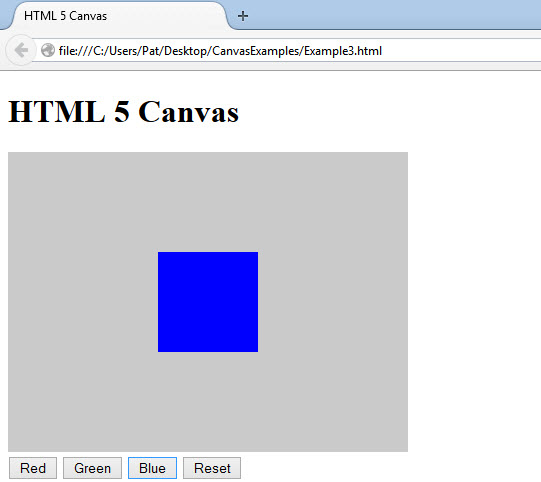
In this example I’ve introduced the “canvas” element to the page, shaded the background to a silver colour and then drawn a square on it. I’ve added a function to the body section of the page to draw the square in different colours and replaced the OnClick events of the four buttons from Example 2 with calls to the box drawing function for each colour.
Between the opening and closing tags of the “canvas” element, I’ve included a message for those visiting the page from a browser that doesn’t support HTML5.
<!doctype html>
<html lang=”en”>
<head>
<meta charset=”utf-8″ />
<title>HTML 5 Canvas</title>
<script>
function O(obj)
{
if (typeof obj == ‘object’)
return obj;
else
return document.getElementById(obj);
}
function S(obj)
{
return O(obj).style;
}
</script>
</head>
<body onLoad=”Box(‘black’);”>
<h1 id=”title”>HTML 5 Canvas</h1>
<canvas id=”canvas1″ width=”400″ height=”300″>
This web page uses the HTML5 canvas element, which is available on most modern browsers. Please upgrade your existing browser or download a modern browser such as <a href=”https://www.google.com/intl/en_uk/chrome/browser/”>Google Chrome</a>.
</canvas>
<script>
pic = O(‘canvas1’);
// canvas tag only supports width and height but you can still style the canvas
S(pic).background = ‘#cacaca’;
// canvas has no drawing abilities of its own (it is a container for graphics) so need a context
context = pic.getContext(‘2d’);
function Box(col) {
context.fillStyle = col;
context.fillRect(150, 100, 100, 100);
}
</script>
<br />
<input type=”button” value=”Red” onClick=”Box(‘red’);” />
<input type=”button” value=”Green” onClick=”Box(‘green’);” />
<input type=”button” value=”Blue” onClick=”Box(‘blue’);” />
<input type=”button” value=”Reset” onClick=”Box(‘black’);” />
</body>
</html>
The above code will display a silver canvas with four buttons that each draw a coloured box. I have also added drawing of a black square as part of the initial page loading by adding a call to the function in the OnLoad event of the “body” section.
Before we go any further I just want to explain what the code is doing if it were written outside of the Box function.
- pic = O(‘canvas1’); creates a variable called “pic” and assigns the “canvas” object to it
- S(pic).background = ‘#cacaca’; sets the background colour of the “canvas” object to #cacaca (silver)
- context = pic.getContext(‘2d’); creates a variable called “context” and applies a drawing context of the “canvas” object allowing you to actually draw on the canvas
- context.fillStyle = ‘red’; sets the fill colour of anything you will be drawing on the canvas to red
- context.fillRect(150, 100, 100, 100); actually draws the square. From the top left corner it moves 150 pixels to the right and 100 pixels towards the bottom. From that point it then uses that as the top left corner of the square it draws that is 100 pixels wide and high.
4. Creating an image from the canvas
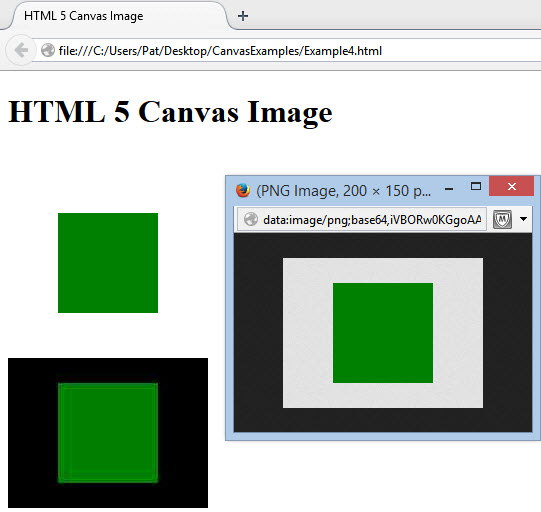
In this example I will draw a square on the canvas but render it on the page as a normal image and then a reduced quality image. It will also call the image in a pop-up window so that you can see that the image does not rely on the canvas to render.
<!doctype html>
<html lang=”en”>
<head>
<meta charset=”utf-8″ />
<title>HTML 5 Canvas Image</title>
<script>
function O(obj)
{
if (typeof obj == ‘object’)
return obj;
else
return document.getElementById(obj);
}
function S(obj)
{
return O(obj).style;
}
</script>
</head>
<body>
<h1 id=”title”>HTML 5 Canvas Image</h1>
<canvas id=”canvas1″ width=”200″ height=”150″>
This web page uses the HTML5 canvas element, which is available on most modern browsers. Please upgrade your existing browser or download a modern browser such as <a href=”https://www.google.com/intl/en_uk/chrome/browser/”>Google Chrome</a>.
</canvas>
<p><img id=’image1′ /></p>
<p><img id=’image2′ /></p>
<script>
pic = O(‘canvas1’);
S(pic).background = ‘#cacaca’;
S(pic).margin = ‘-500px’;
context = pic.getContext(‘2d’);
context.fillStyle = ‘green’;
context.fillRect(50, 25, 100, 100);
O(‘image1’).src = pic.toDataURL(); // Default equals PNG – equiv ‘image/png’
O(‘image2’).src = pic.toDataURL(‘image/jpeg’, 0.3); // 30% quality (0 = low res, 1 = normal) only works for JPG
// It is also possible to show the picture in a new popup window
dataUrl = pic.toDataURL();
window.open(dataUrl, “toDataURL() image”, “width=300, height=200”);
</script>
</body>
</html>
The above code creates a silver canvas with a green square. However, the canvas is moved off-screen so you can’t see it. What you will view is two images that are populated by the canvas. The “img” tag has no “src” element so it will not display anything until it is given the contents of the canvas as a data string. The canvas has a “toDataURL” method that returns a PNG image by default. When rendered on the page the image is transparent so the background does not display for PNG and converts the background to black for JPEG. However, on some browsers when rendered as an image outside of the page the background is included. This is why the image in the pop-up window has the silver background using Firefox but the image on the page at the top (PNG) is white (same as the page background) and the image beneath (JPG) has a black background. When rending as a JPEG you can also reduce the quality of the image. However, if you reduce the quality too much you will start to notice artefacts (a term for distortion) which are very clear in the bottom image where I have reduced it to 30% of its original quality.
Note: that converting to image applies to “canvas” object rather than the “context”.
5. Fill styles including gradients
In this example I will draw some shapes using gradients. A gradient is a colour fill that goes from a starting colour to an ending colour through various intermediary points.
<!doctype html>
<html lang=”en”>
<head>
<meta charset=”utf-8″ />
<title>HTML 5 Canvas</title>
<script>
function O(obj)
{
if (typeof obj == ‘object’)
return obj;
else
return document.getElementById(obj);
}
function S(obj)
{
return O(obj).style;
}
</script>
</head>
<body>
<h1 id=”title”>HTML 5 Canvas Fills</h1>
<canvas id=”canvas1″ width=”190″ height=”250″>
This web page uses the HTML5 canvas element, which is available on most modern browsers. Please upgrade your existing browser or download a modern browser such as <a href=”https://www.google.com/intl/en_uk/chrome/browser/”>Google Chrome</a>.
</canvas>
<canvas id=”canvas2″ width=”310″ height=”250″></canvas>
<br />
<div style=”float:left;height:200px;”>
<canvas id=”canvas3″ width=”190″ height=”200″></canvas>
</div>
<div style=”float:left;width:300px;margin-left:10px;”>
<p>Style rules:
<br />applies to all actions until changed
<br />fillStyle = ‘steelblue'</p>
<p>Gradients:
<br />co-ordinates relative to the whole canvas
<br />createLinearGradient(x1,y1,x2,y2)
<br />createRadialGradient(x1,y1,r1,x2,y2,r2)</p>
</div>
<script>
pic1 = O(‘canvas1’);
S(pic1).background = ‘#cacaca’;
context1 = pic1.getContext(‘2d’);
context1.fillStyle = ‘steelblue’;
context1.fillRect(10, 10, 170, 230);
context1.clearRect(20, 20, 150, 210);
context1.strokeRect(30, 30, 130, 190);
pic2 = O(‘canvas2’);
S(pic2).background = ‘yellow’;
context2 = pic2.getContext(‘2d’);
gradient = context2.createLinearGradient(10,10,90,230); // from top left corner to bottom right
gradient.addColorStop(0, ‘#ffffff’); // white
gradient.addColorStop(1, ‘#000000’); // black
context2.fillStyle = gradient;
context2.fillRect(10,10,90,230);
gradient = context2.createLinearGradient(145,10,145,230); // from top middle to bottom middle
gradient.addColorStop(0, ‘#ff0000’); // red
gradient.addColorStop(1, ‘#000000’); // black
context2.fillStyle = gradient;
context2.fillRect(110,10,90,230);
gradient = context2.createLinearGradient(210,125,300,125); // from middle left to middle right
gradient.addColorStop(0, ‘#ffffff’); // white
gradient.addColorStop(1, ‘#0000ff’); // blue
context2.fillStyle = gradient;
context2.fillRect(210,10,90,230);
pic3 = O(‘canvas3’);
S(pic3).background = ‘steelblue’;
context3 = pic3.getContext(‘2d’);
gradient3 = context3.createRadialGradient(95,100,0,95,100,80); // radius 0 is the middle to radius 80 pixels
gradient3.addColorStop(0.00, ‘red’);
gradient3.addColorStop(0.16, ‘orange’);
gradient3.addColorStop(0.33, ‘yellow’);
gradient3.addColorStop(0.50, ‘green’);
gradient3.addColorStop(0.66, ‘blue’);
gradient3.addColorStop(0.83, ‘indigo’);
gradient3.addColorStop(1.00, ‘violet’);
context3.fillStyle = gradient3;
context3.fillRect(10,10,170,180);
</script>
</body>
</html>
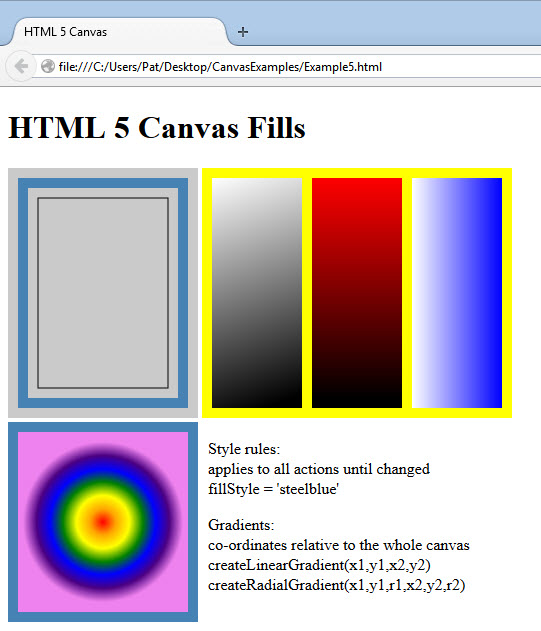
The above sets up 3 canvas areas on the page. Note that I only put the browser compatibility comment on the first one.
Canvas 1 creates a large filled rectangle “fillRect” then a smaller clearing rectangle “clearRect” that cuts out and finally a third rectangle “strokeRect” that is transparent (not filled) smaller than the other two. We could have used two unfilled rectangles using “strokeRect” but I wanted to show you how to cut out an area of a filled rectangle or any other shape on the canvas. By setting the fill colour beforehand the first rectangle is drawn using steelblue. However, I didn’t set the stroke colour or width so it is set to the defaults of black and 1 pixel. All rectangles are drawn based on the position from the left, position from the top, width and height, e.g. fillRect(position-from-left, position-from-top, width, height).
Canvas 2 creates three linear gradient fills to show how you can set a gradient to run from different positions. The first from top left corner to bottom right, the second from top middle to bottom middle and the third from middle left to middle right. You use the “createLinearGradient” to fill a gradient from one place to another. All gradients are drawn based on the start position from the left, start position from the top, end position from the left and end position from the top, e.g. createLinearGradient(position-from-left-1, position-from-top-1, position-from-left-2, position-from-top-2).
Canvas 3 creates a circular gradient fill and in this example I have used gradient stops to change the colours throughout the area. You use the “createRadialGradient” to fill a circular shaped gradient from one place to another. It is similar to the linear type but you specify the position from the centre to start the gradient (zero is the dead centre) and the outermost position to finish the gradient (in this example I’ve used 80 which happens to be the radius of the shape, e.g. createRadialGradient(position-from-left-1, position-from-top-1, radius-1, position-from-left-2, position-from-top-2m, radius-2). I’ve chosen colour stops to change the colours as the gradient progresses through the colours of the rainbow from red in the middle to violet at the outer edge. The colour stop has a position along the length of the gradient with 0 being the inner most point and 1 being the outer most. A colour stop at 0.5 would be half way between the start and the end points.
6. Pattern fills and text
In this example I will use an image as a background fill on a shape, write some text on the canvas and then write some text that uses the image as a pattern to fill the text. Finally, I will show you how to determine the size of your text within the canvas.
<!doctype html>
<html lang=”en”>
<head>
<meta charset=”utf-8″ />
<title>HTML 5 Canvas</title>
<script>
function O(obj)
{
if (typeof obj == ‘object’)
return obj;
else
return document.getElementById(obj);
}
function S(obj)
{
return O(obj).style;
}
</script>
</head>
<body>
<h1 id=”title”>HTML 5 Canvas Patterns and Text</h1>
<canvas id=”canvas1″ width=”500″ height=”200″>
This web page uses the HTML5 canvas element, which is available on most modern browsers. Please upgrade your existing browser or download a modern browser such as <a href=”https://www.google.com/intl/en_uk/chrome/browser/”>Google Chrome</a>.
</canvas><br />
<canvas id=”canvas2″ width=”500″ height=”200″>
</canvas>
<script>
pic1 = O(‘canvas1’);
S(pic1).border = ‘solid thin grey’;
context1 = pic1.getContext(‘2d’);
image1 = new Image();
image1.src = ‘Koala-small.jpg’;
image1.onload = function()
{
pattern1 = context1.createPattern(image1, ‘repeat’); // ‘repeat’ for repeat both directions, ‘no-repeat’, ‘repeat-x’, ‘repeat-y’ for repeat vertically
context1.fillStyle = pattern1;
context1.fillRect(10, 10, 240, 180);
}
context1.fillStyle = ‘black’;
context1.textAlign = ‘center’;
context1.textBaseline = ‘middle’;
context1.font = ’16px Arial’;
context1.strokeText(‘\’repeat\’ for repeat both directions’, 375, 20);
context1.strokeText(‘\’no-repeat\’ for no repeatong’, 375, 40);
context1.strokeText(‘\’repeat-x\’ for repeat horizontally’, 375, 60);
context1.strokeText(‘\’repeat-y\’ for repeat vertically’, 375, 80);
pic2 = O(‘canvas2’);
S(pic2).border = ‘solid thin grey’;
S(pic2).background = ‘silver’;
context2 = pic2.getContext(‘2d’);
context2.font = ‘116pt Impact’;
image2 = new Image();
image2.src = ‘Koala-small.jpg’;
image2.onload = function()
{
pattern2 = context2.createPattern(image2, ‘repeat’);
context2.fillStyle = pattern2;
context2.fillText(‘CANVAS’, 5, 175);
}
metrics = context2.measureText(‘CANVAS’);
alert(‘Text width: ‘ + metrics.width + ‘ pixels’);
</script>
</body>
</html>
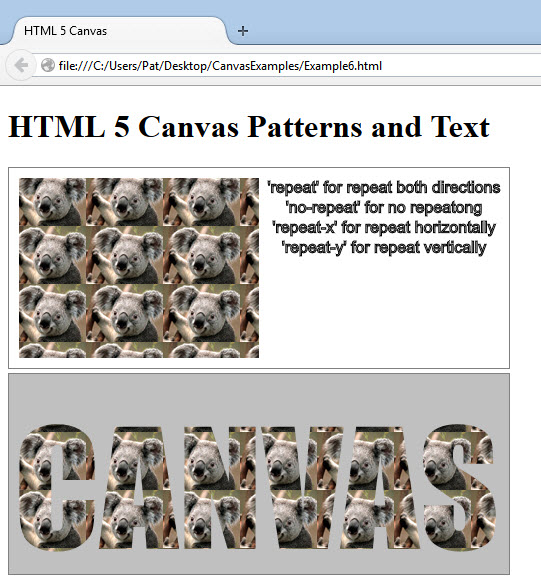
The above sets up 2 canvas areas on the page. In the first one I have created a shape but used an image of a Koala (thank you Microsoft for providing that with Windows) as a pattern to fill it. To do this you create a new image placeholder in memory “image1 = new Image();” then tell the new image where the source is “image1.src = ‘Koala-small.jpg’;” and finally you tell the image what to do when it has loaded “image1.onload = function()”. The lines that follow the “function” are the instructions to fill a rectangle with the Koala image and repeat it in both directions until the shape is filled.
You can writing on the canvas by using “strokeText”. This uses the actual text with a start position (across the page and then down it). All of the text attributes such as the font, size, alignment and colour are set before applying the “strokeText”. In my example, I’ve set the text to centre and middle alignment so the position refers the exact middle of the text I am writing on the canvas.
You can also write text on the canvas and apply a pattern to it. As you can see on the second canvas, I have combined the first two methods above to write the word canvas with a pattern fill of the Koala. As I haven’t set the alignment for this context, the default of left and bottom alignment applies so the position of the bottom left corner of the text is from the left and top of the canvas. I did set the font and size to 116 point Impact and if I wanted to find out how much space that has taken up on the canvas I can use the “measureText” metrics of the context. I’ve used the JavaScript “alert” function to pop up a message box about the number of pixels wide the word is.
7. Lines, paths and joins
In this example I have drawn various lines and shapes on the page to illustrate the different types of lines and joins and the path of shapes.
<!doctype html>
<html lang=”en”>
<head>
<meta charset=”utf-8″ />
<title>HTML 5 Canvas</title>
<script>
function O(obj)
{
if (typeof obj == ‘object’)
return obj;
else
return document.getElementById(obj);
}
function S(obj)
{
return O(obj).style;
}
</script>
</head>
<body>
<h1 id=”title”>HTML 5 Canvas Lines and Paths</h1>
<canvas id=”canvas1″ width=”500″ height=”450″>
This web page uses the HTML5 canvas element, which is available on most modern browsers. Please upgrade your existing browser or download a modern browser such as <a href=”https://www.google.com/intl/en_uk/chrome/browser/”>Google Chrome</a>.
</canvas>
<p>lineCap = ‘butt’ or ’round’ or ‘square'</p>
<p>lineJoin = ‘bevel’ or ’round’ or ‘miter'</p>
<script>
pic1 = O(‘canvas1’);
S(pic1).border = ‘solid thin grey’;
context1 = pic1.getContext(‘2d’);
context1.lineWidth = 20;
context1.lineCap = ‘square’;
context1.lineJoin = ‘miter’;
context1.moveTo(40,40);
context1.lineTo(40,180);
context1.lineTo(180,180);
context1.stroke();
context1.beginPath();
context1.moveTo(40,220);
context1.lineTo(40,400);
context1.lineTo(180,400);
context1.closePath();
context1.stroke();
context1.lineWidth = 3;
context1.lineCap = ‘butt’;
context1.lineJoin = ‘bevel’;
context1.beginPath();
context1.rect(210,40,230,90);
context1.closePath();
context1.stroke();
context1.beginPath();
context1.moveTo(210,150);
context1.lineTo(440,150);
context1.lineTo(440,240);
context1.lineTo(210,240);
context1.closePath(); // completes the rectangle
context1.fill();
context1.beginPath();
context1.rect(230,60,190,160);
context1.closePath(); // completes the rectangle
context1.stroke();
context1.fillStyle = ‘white’;
context1.fill();
context1.strokeStyle = ‘blue’;
context1.lineWidth = 10;
context1.beginPath();
context1.lineCap = “round”;
context1.moveTo(245,310);
context1.lineTo(445,310);
context1.stroke();
context1.beginPath();
context1.lineCap = “butt”;
context1.moveTo(245,330);
context1.lineTo(445,330);
context1.stroke();
context1.beginPath();
context1.lineCap = “square”;
context1.moveTo(245,350);
context1.lineTo(445,350);
context1.stroke();
</script>
</body>
</html>
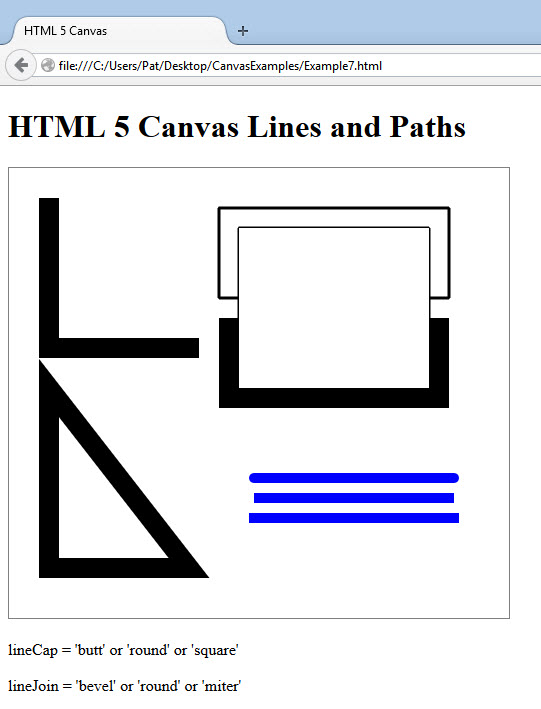
The above code draws some lines by plotting paths. We use the “moveTo” function to identify the starting position of the path and the “lineTo” function to identify the end point and draw a line to it. Every line can have one of three endings, butt, round or square and the blue lines show the differences with butt having no end and round and square extending the end of the line to cover the cap. You identify this using the “lineCap” function of the context.
When two lines join, you can indicate how they should display the join using the “lineJoin” function, bevel, round or miter. A normal rectangle join is a bevel and you can specify rounded corners using round. If you want to corner to form a point then use miter. Also on the example, I have drawn some overlapping shapes. The best thing to do is to modify the JavaScript to see the differences on the page for yourself.
8. Arcs, circles and curves
In this example I have drawn various curvy shapes starting with simple arcs and then circles both filled and unfilled and then drawn a wavy line.
<!doctype html>
<html lang=”en”>
<head>
<meta charset=”utf-8″ />
<title>HTML 5 Canvas</title>
<script>
function O(obj)
{
if (typeof obj == ‘object’)
return obj;
else
return document.getElementById(obj);
}
function S(obj)
{
return O(obj).style;
}
</script>
</head>
<body>
<h1 id=”title”>HTML 5 Canvas Curves</h1>
<canvas id=”canvas1″ width=”520″ height=”450″>
This web page uses the HTML5 canvas element, which is available on most modern browsers. Please upgrade your existing browser or download a modern browser such as <a href=”https://www.google.com/intl/en_uk/chrome/browser/”>Google Chrome</a>.
</canvas>
<p>arc(x,y,r,s,e,d) – x & y co-ordinates from top left, radius, radian offset
<br />start (0 = 3 o’clock), radians to draw (PI x 2 for complete circle),
<br />direction (clockwise = false)</p>
<script>
pic1 = O(‘canvas1’);
S(pic1).border = ‘solid thin grey’;
context1 = pic1.getContext(‘2d’);
context1.beginPath();
context1.moveTo(55,85);
context1.arc(55,85,45,0,Math.PI / 2, false);
context1.closePath(); // completes the path back to the middle
context1.stroke();
context1.beginPath();
context1.moveTo(155,85);
context1.arc(155,85,45,0,Math.PI, false);
context1.closePath(); // completes the path back to the middle
context1.stroke();
context1.beginPath();
context1.moveTo(255,85);
context1.arc(255,85,45,0,Math.PI / 2 * 3, false);
context1.closePath(); // completes the path back to the middle
context1.stroke();
context1.beginPath();
context1.moveTo(355,85);
context1.arc(355,85,45,0,Math.PI * 2, false);
context1.closePath(); // completes the path back to the middle
context1.stroke();
context1.beginPath();
context1.moveTo(455,85);
context1.arc(455,85,45,0,Math.PI * 2, false);
context1.closePath(); // completes the path back to the middle
context1.fill();
context1.strokeStyle = ‘blue’;
context1.fillStyle = ‘yellow’;
context1.beginPath();
context1.arc(55,185,45,0,Math.PI / 2, false);
context1.stroke();
context1.closePath();
context1.beginPath();
context1.arc(155,185,45,0,Math.PI, false);
context1.stroke();
context1.closePath();
context1.beginPath();
context1.arc(255,185,45,0,Math.PI / 2 * 3, false);
context1.stroke();
context1.closePath();
context1.beginPath();
context1.arc(355,185,45,0,Math.PI * 2, false);
context1.stroke();
context1.closePath();
context1.beginPath();
context1.arc(455,185,45,0,Math.PI * 2, false);
context1.fill();
context1.closePath();
context1.strokeStyle = ‘red’;
context1.beginPath();
context1.moveTo(55,385);
context1.bezierCurveTo(0,0,310,490,370,385);
context1.stroke();
context1.closePath();
</script>
</body>
</html>
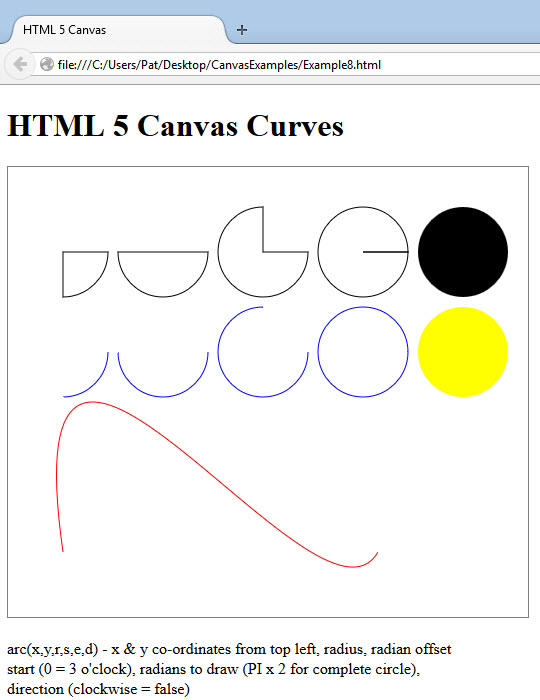
The above code draws some arcs on the first row and then closes the path back to the centre. The last one fills the circle. The second row does exactly the same thing but draws arcs that do not return back the centre with the last one filled yellow. Circles and arcs are drawn using the “arc” or “arcTo” function. The “arc” function specifies the position of the central point of the circle or arc from the top left of the canvas. Then it specifies the radius (half the diameter) and the radian offset (position around the circle starting from 0 which is the 3 o’clock position. How far around to draw in radians is the next thing it needs and finally which direction to draw. The distance of a radian is calculated using PI for a half circle (180 degrees) so 2 times PI will be a complete circle (360 degrees). PI divided by 2 is a quarter (90 degrees) and PI times 1.5 is three quarters (270 degrees). Clockwise direction is “false” and anti-clockwise is “true”.
The “arcTo” function is similar to the “arc” function but only specifies a start and end position and the radius of the arc. There is a function that is similar to the “arcTo” function that I’ve omitted called the “quadraticCurveTo” function that takes a start position and an end position and calculates the curve accordingly to an imaginary attractor that has been previously specified with the “moveTo” function. Have a play with this yourself.
The third row I’ve had some fun plotting a biezer curve using the “bezierCurveTo” function, which again you should play around with yourself to see how it really works. This works the same way as the “quadraticCurveTo” function but has two imaginary attractors. The “moveTo” function still specifies the first attractor point but th second attractor is specified in the function itself.
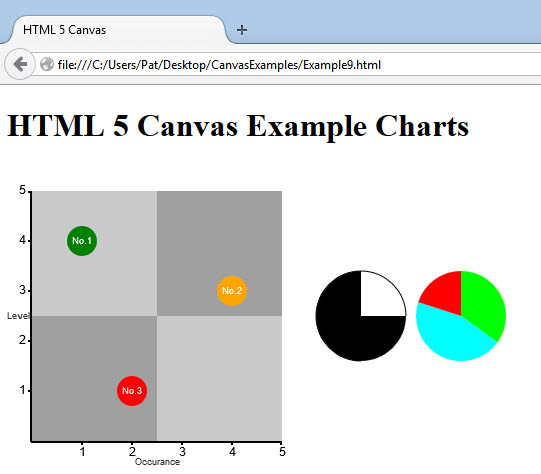
9. Example charts
In this final set of examples, I have drawn a couple of charts directly onto the canvas using the techniques covered the previous examples.
<!doctype html>
<html lang=”en”>
<head>
<meta charset=”utf-8″ />
<title>HTML 5 Canvas</title>
<script>
function O(obj)
{
if (typeof obj == ‘object’)
return obj;
else
return document.getElementById(obj);
}
function S(obj)
{
return O(obj).style;
}
</script>
</head>
<body>
<h1 id=”title”>HTML 5 Canvas Example Charts</h1>
<canvas id=”areaCanvas” width=”300″ height=”300″>
This web page uses the HTML5 canvas element, which is available on most modern browsers. Please upgrade your existing browser or download a modern browser such as <a href=”https://www.google.com/intl/en_uk/chrome/browser/”>Google Chrome</a>.
</canvas> <canvas id=”pieCanvas” width=”220″ height=”300″></canvas>
<script>
// set up canvas
canvas = O(‘areaCanvas’);
S(canvas).background = ‘#FFF’;
context = canvas.getContext(‘2d’);
// top left
context.fillStyle = ‘#cacaca’;
context.fillRect(25,25,125,125);
// bottom right
context.fillRect(150,150,125,125);
// bottom left
context.fillStyle = ‘#a0a0a0’;
context.fillRect(25,150,125,125);
// top right
context.fillRect(150,25,125,125);
// axis
context.fillStyle = ‘#000′;
context.beginPath();
context.lineWidth = 2;
// axis lines
context.moveTo(24,25);
context.lineTo(24,276);
context.moveTo(24,276);
context.lineTo(275,276);
// axis points left
context.moveTo(24,26);
context.lineTo(21,26);
context.moveTo(24,75);
context.lineTo(21,75);
context.moveTo(24,125);
context.lineTo(21,125);
context.moveTo(24,175);
context.lineTo(21,175);
context.moveTo(24,225);
context.lineTo(21,225);
// axis points right
context.moveTo(75,276);
context.lineTo(75,279);
context.moveTo(125,276);
context.lineTo(125,279);
context.moveTo(175,276);
context.lineTo(175,279);
context.moveTo(225,276);
context.lineTo(225,279);
context.moveTo(274,276);
context.lineTo(274,279);
context.closePath();
context.stroke();
// axis left numbers
context.font = ’12px Arial’;
context.fillStyle = ‘#000’;
context.textBaseline = ‘middle’;
context.fillText(‘5’,12,25);
context.fillText(‘4’,12,75);
context.fillText(‘3’,12,125);
context.fillText(‘2’,12,175);
context.fillText(‘1’,12,225);
context.fillStyle = ‘#333’;
context.font = ‘9px Arial’;
context.fillText(‘Level’,0,150);
// axis bottom numbers
context.font = ’12px Arial’;
context.fillStyle = ‘#000’;
context.textAlign = ‘center’;
context.fillText(‘1’,75,287);
context.fillText(‘2’,125,287);
context.fillText(‘3’,175,287);
context.fillText(‘4’,225,287);
context.fillText(‘5’,275,287);
context.fillStyle = ‘#333’;
context.font = ‘9px Arial’;
context.fillText(‘Occurance’,150,296);
// Draw shapes
context.fillStyle = ‘green’;
context.beginPath();
context.moveTo(75,75);
context.arc(75,75,15,0,Math.PI * 2, false);
context.closePath();
context.fill();
context.font = ‘9px Arial’;
context.fillStyle = ‘white’;
context.textAlign = ‘center’;
context.textBaseline = ‘middle’;
context.fillText(‘No.1’,75,75);
context.fillStyle = ‘orange’;
context.beginPath();
context.moveTo(225,125);
context.arc(225,125,15,0,Math.PI * 2, false);
context.closePath();
context.fill();
context.font = ‘9px Arial’;
context.fillStyle = ‘white’;
context.textAlign = ‘center’;
context.textBaseline = ‘middle’;
context.fillText(‘No.2’,225,125);
context.fillStyle = ‘red’;
context.beginPath();
context.moveTo(125,225);
context.arc(125,225,15,0,Math.PI * 2, false);
context.closePath();
context.fill();
context.font = ‘9px Arial’;
context.fillStyle = ‘white’;
context.textAlign = ‘center’;
context.textBaseline = ‘middle’;
context.fillText(‘No.3’,125,225);
// set up canvas
canvas2 = O(‘pieCanvas’);
S(canvas2).background = ‘#FFF’;
context2 = canvas2.getContext(‘2d’);
context2.beginPath();
context2.moveTo(50,150); // specify move to to make the slice
context2.arc(50,150,45,0,Math.PI / 2 * 3, false); // PI = half circle so PI/2*3 = 3/4s full starting at 0 = 3 oclock
context2.closePath();
context2.fill(); // colours it in
context2.beginPath();
// no move to just makes an arc
context2.arc(50,150,45,0,Math.PI / 2, true); // PI/2 = 1/4s full starting at 0 = 3 oclock but backwards (true)
context2.stroke();
context2.closePath();
context2.beginPath();
// PI = half circle (PI x 2 = full circle) so PI*2 / percentage
var base = Math.PI*1.5 // 12 oclock postion
var end = base;
var start = base;
var low = 35;
var medium = 45;
var high = 20;
context2.fillStyle = ‘#00ff00’;
context2.moveTo(150,150);
end = start+Math.PI*(low/50)
if (end > (Math.PI*2)) end -= Math.PI*2;
context2.arc(150,150,45,start,end,false);
context2.closePath();
context2.fill();
context2.beginPath();
context2.moveTo(150,150);
context2.fillStyle = ‘#00ffff’;
start += Math.PI*((low)/50);
if (start > (Math.PI*2)) start -= Math.PI*2;
end = start+Math.PI*((medium)/50)
if (end > (Math.PI*2)) end -= Math.PI*2;
context2.arc(150,150,45,start,end,false);
context2.closePath();
context2.fill();
context2.beginPath();
context2.moveTo(150,150);
context2.fillStyle = ‘#ff0000’;
start += Math.PI*((medium)/50);
if (start > (Math.PI*2)) start -= Math.PI*2;
context2.arc(150,150,45,start,base,false);
context2.closePath();
context2.fill();
</script>
</body>
</html>
I am not going to explain all of the above code but if you really want to see what is going on the best thing to do is to download the example (or copy the above code into a page) and have a play around with it yourself.
I have set two small canvases up, one for a bubble plot type chart and the other for a couple of pie charts. In the bubble chart, I have drawn the 4 background boxes first, then drawn the axis, added marks along the axis, added labels to those marks and given each a description before plotting three different bubbles all with separate colours.
The two pie charts are both drawn in different ways. The black and white one consists of a filled circle for 270 degrees (1.5 radians) and then an arc to complete the circle. The final coloured pie chart sets a starting position at 12 o’clock rather than at 3 o’clock.
HTML5 canvas examples
All the code for the examples is shown on this page so just copy that into your HTML editor or Notepad and save as a .HTML file to view it. The Koala picture comes with Windows in the Sample Pictures folder.
For convenience you can download all of the HTML5 Canvas examples here.
I hope that this article has helped you have a better understanding of the HTML 5 Canvas. The best thing to do it to try it out for yourself. Have fun!
Related articles
This is part of a series of articles covering the new features of HTML5. You can find an up-to-date list of those from the Development – HTML5 category.